
Figure 5.
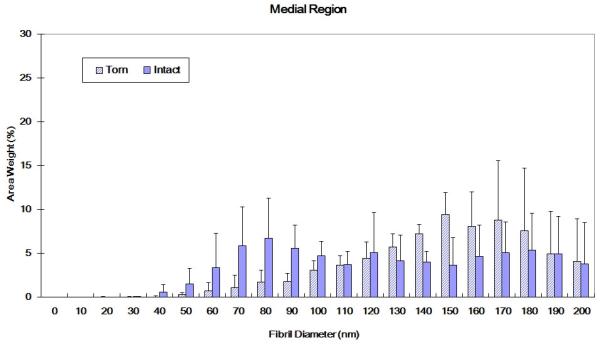
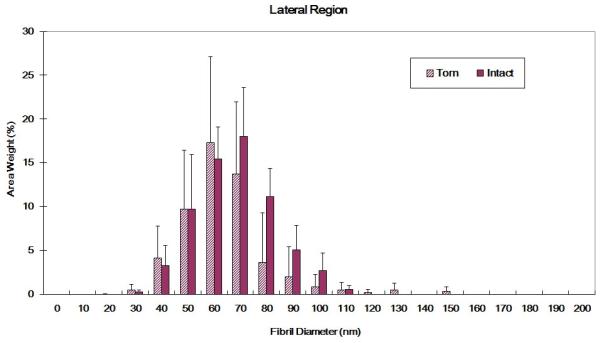
(A) Collagen fibril diameter distributions for intact and torn medial tendon regions (medial region of intact tendon shows a bimodal distribution; torn tendons exhibited more large diameter collagen fibrils. K-S test: p<0.01) (B) Collagen fibril diameter distributions for intact and torn lateral tendon regions (torn tendon shows trend towards smaller fibrils and wider distribution than intact tendon, K-S test: p<0.01)