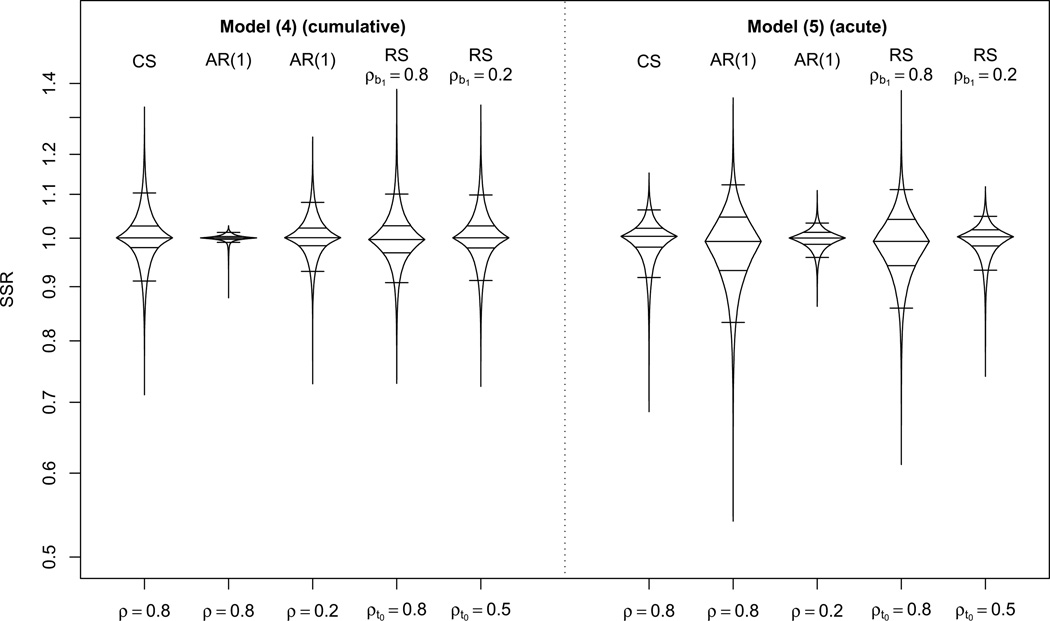
Figure 4.
Box-percentile plots of the ratio of required sample sizes obtained when incorrectly assuming CS covariance of exposure divided by the required sample size obtained using the true exposure covariance in 10,000 scenarios generated to have an arbitrary exposure covariance, for r = 5 and for several correlation structures of the response. For RS models, ρb0,b1 = −0.5 is assumed. At any height, the width of the irregular ”box” is proportional to the percentile of that height. Horizontal lines indicate the 5th, 25th, 50th, 75th and 95th percentiles. Y-axis on logarithmic scale.

