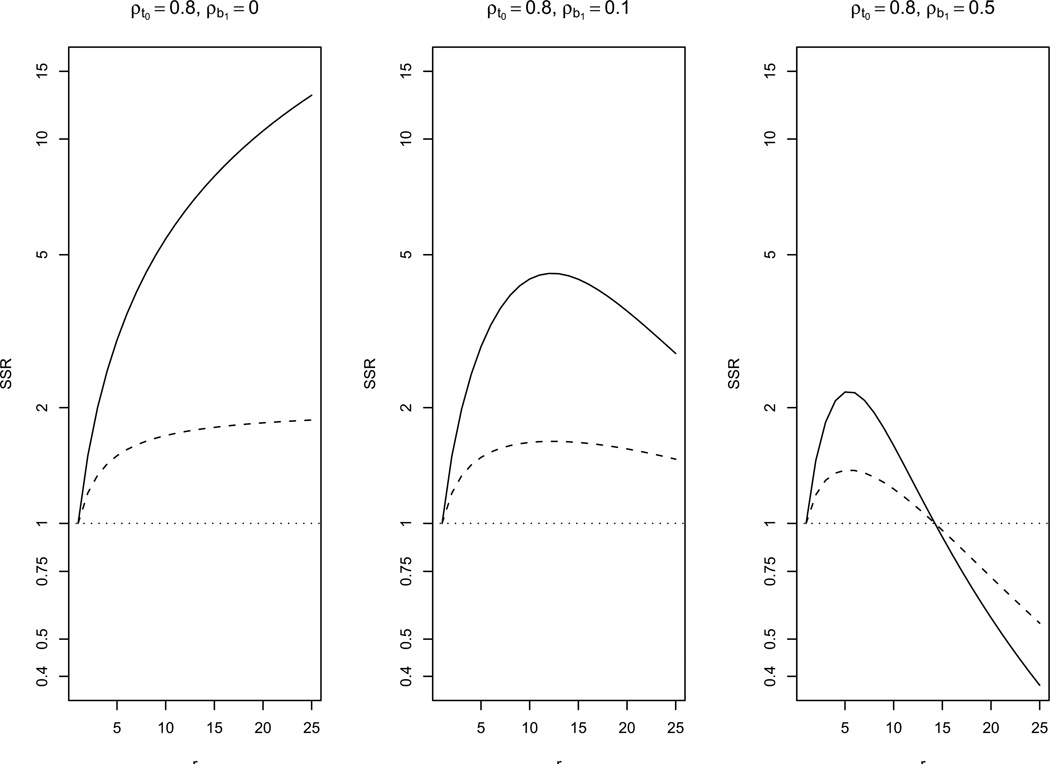
Figure 5.
Sample size ratio (SSR = Nρe/Nρe=1) comparing the required sample size of a study with time-varying exposure to a study with time-invariant exposure when the cumulative exposure effect model (4), RS covariance of the response, CS covariance of exposure, constant exposure prevalence and ρb0,b1 = −0.5 are assumed, for several values of r, ρt0, ρb1 and ρe. Y-axis on logarithmic scale. Lines indicate: (—) ρe = 0, (- - -) ρe = 0.5, (…) ρe = 1.

