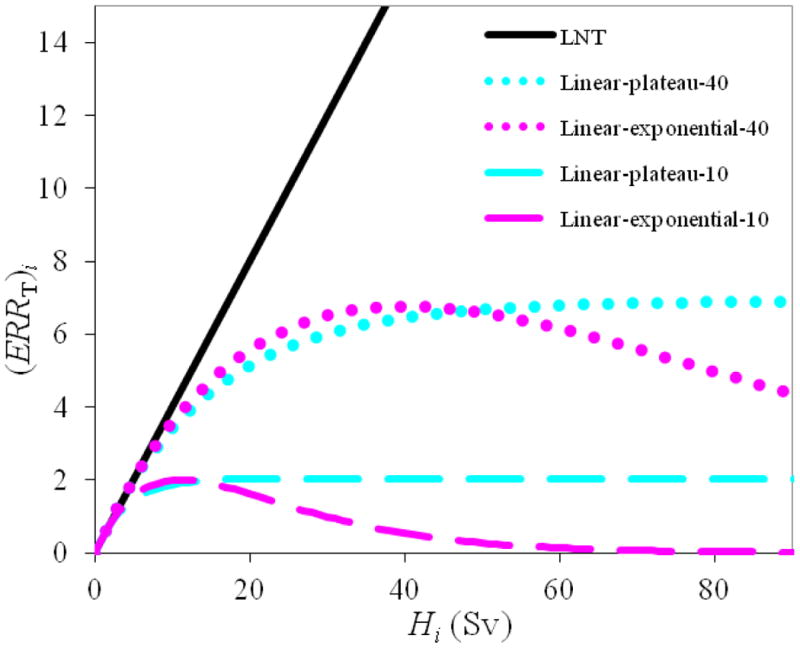
Figure 1.

Examples of the linear-non-threshold (LNT), linear-exponential-10 and -40, and linear-plateau-10 and -40 risk models used to predict ERR for a given tissue (T) and dose-bin (i), corresponding to equations (3), (4), and (5), respectively (Fontenot et al 2009). Volume-weighting for the fractional volume of a specific dose bin, , was set to 1 for this figure.
