
Figure 2.
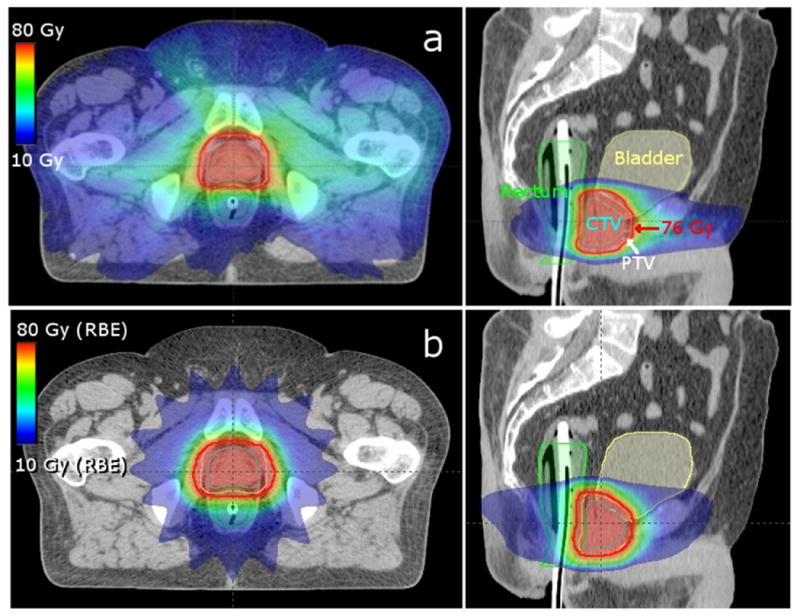
Axial (left) and sagittal (right) images of the medium-sized patient's VMAT (a) and proton arc therapy (b) treatment plans. The prescription isodose line (76 Gy or Gy (RBE)) is outlined in red, the CTV in cyan, the PTV in white, the bladder in yellow, and the rectum in green.