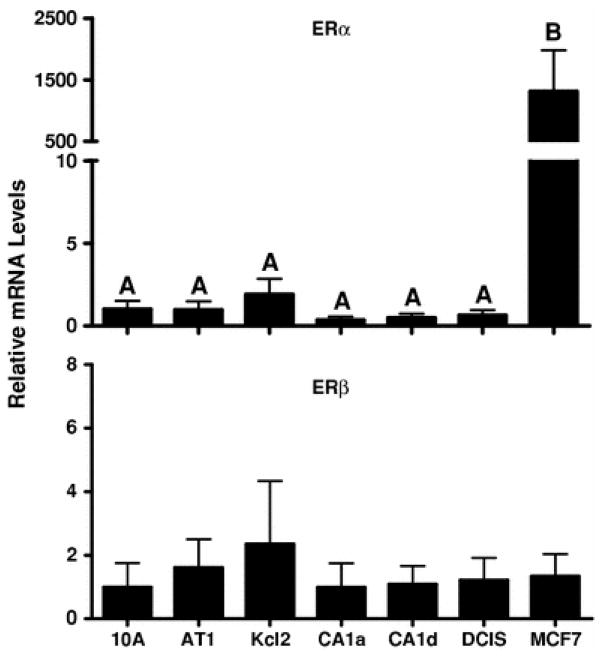
Fig. 4.
ERα and ERβ mRNA expression in MCF10A series and MCF7 cell lines. TaqMan Gene Expression assays were used to determine the relative levels of ERα (top) and ERβ (bottom) mRNA. The mRNA contents of ERα and ERβ are expressed relative to their respective levels in MCF10A cells, and all values represent the mean ± SEM of three independent cell culture experiments. For ERα, groups labeled with different letters are significantly different from each other (P < 0.05). For ERβ, no significant differences among groups were detected

