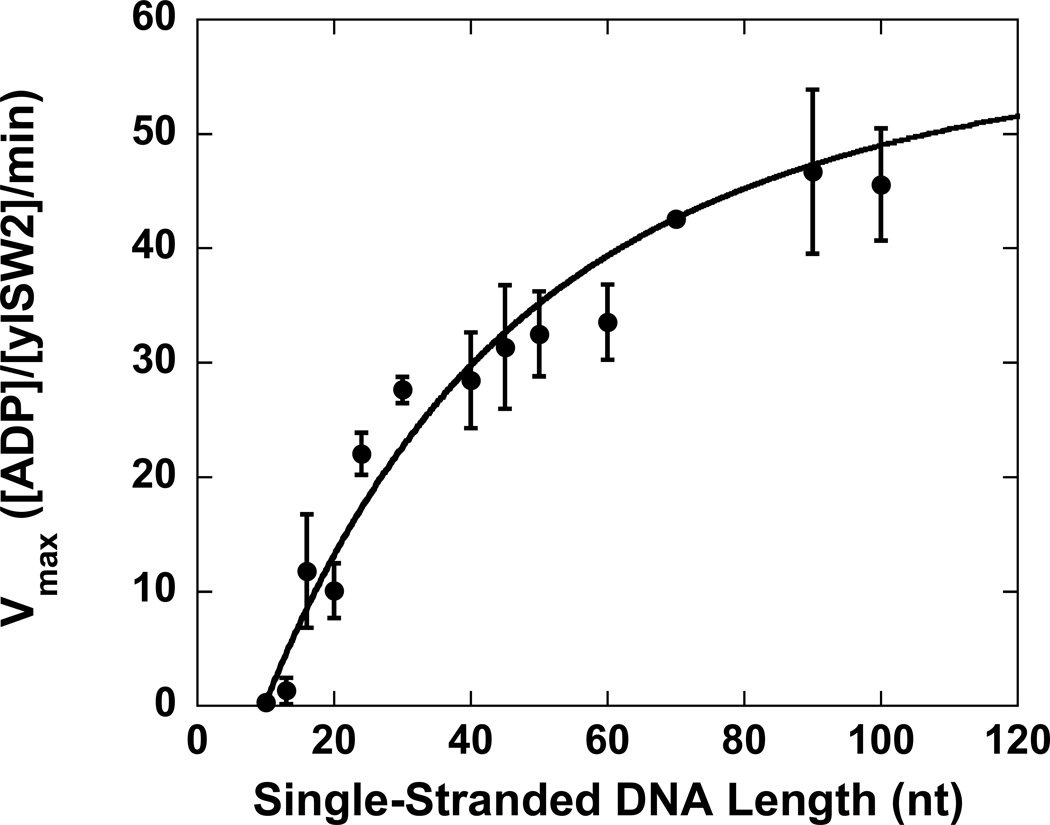
Figure 2.
The dependence of Vmax upon single-stranded DNA length. Each data point is the average of 4 separate measurements of Vmax and the error bars represent the standard deviation of those measurements. The solid line is a NLLS fit of the data to Equation (2) (Scheme 1). The NLLS fits using Equations (10) and (12) are identical. The parameter estimates associated with these fits are in Tables 1 and 2.

