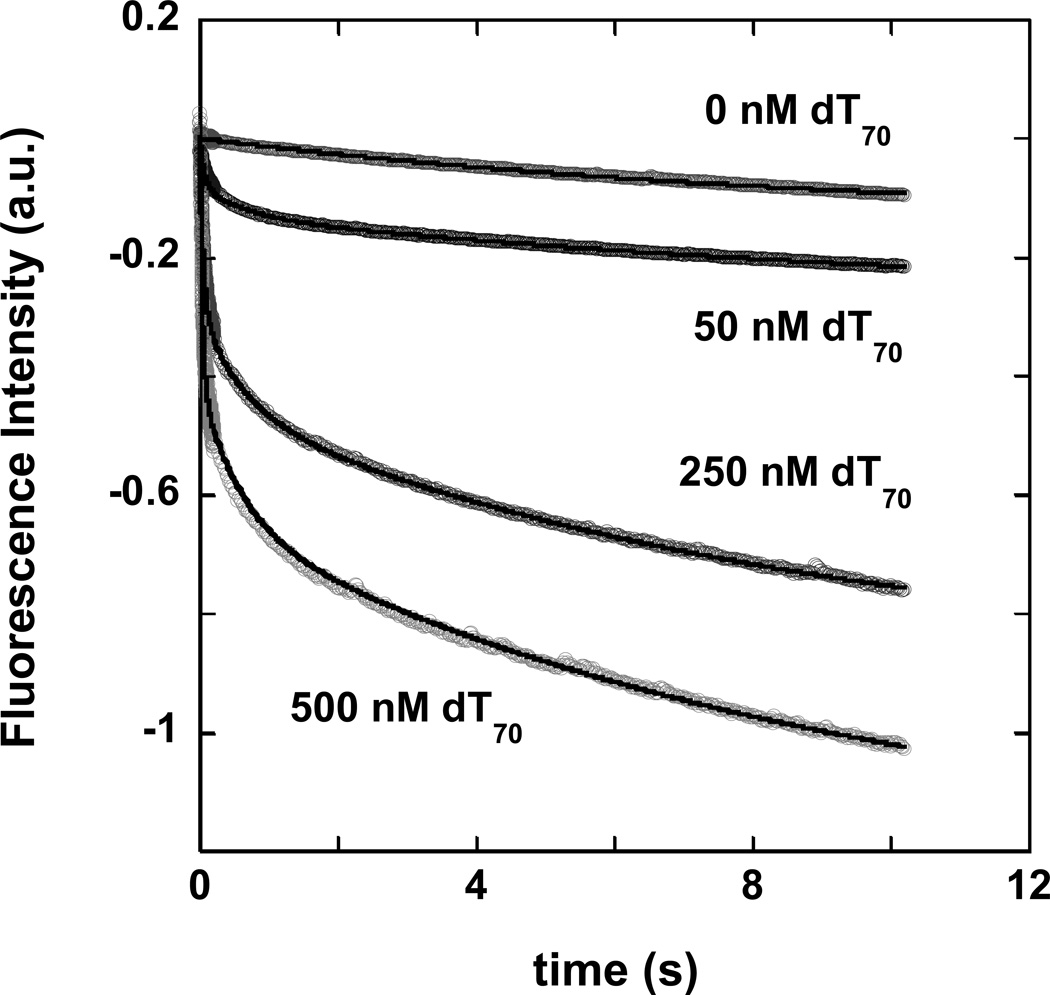
Figure 5.
Kinetics of yISW2 binding to an excess concentration of dT70, monitored by the quenching of the intrinsic tryptophan fluorescence of yIsw2. The time courses were observed in the stopped-flow upon mixing 10 nM yIsw2 (final concentration) with 0, 50, 250, and 500 nM dT70. The solid lines overlaying each time course are NLLS squares fits obtained from global NLLS analysis of the time courses using Equation (11).

