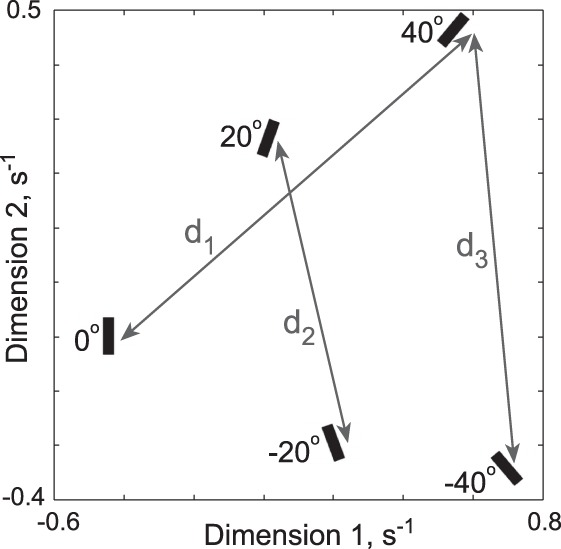
Figure 4.

Representation of orientations in visual search space obtained using multidimensional scaling. Distances between pairs of orientations in this plot are roughly equal to the reciprocal of the average search time involving one orientation among the other for the 32-item displays. Similar plots were obtained for 16- and 24-item displays. Observed search distances and distances in this plot are closely related (r = 1.00, p < 0.00005). However, the observed search distances are not proportional to the angular differences: for instance, despite having the same difference in orientation, the distance d1 between 0° among −40° is larger than the distance d2 between −20° and 20°. Likewise, the distance d3 between 40° and −40°—an orientation difference of 80°—is slightly smaller than d1 even though the latter involves only a 40° difference.
