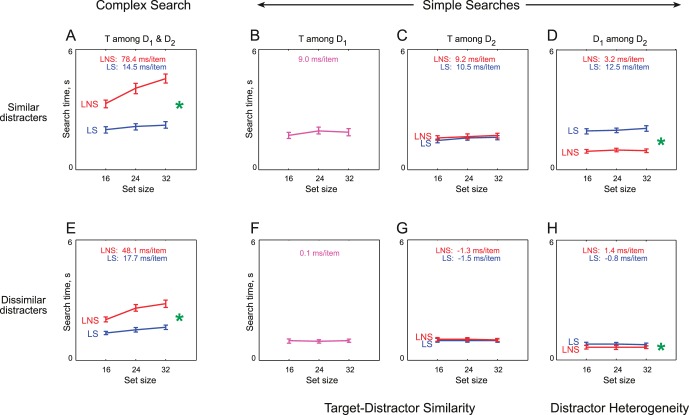
Figure 6.
Search RTs as a function of set size for complex searches and their associated simple searches in Experiment 2. Search times are averaged across conditions in which LNS searches differed significantly from LS searches for the similar distracter conditions (panels A through D, top row) and the dissimilar distracter conditions (panels E through H, bottom row). LNS searches and their associated simple searches are indicated using red lines, and LS searches and their associated simple searches using blue lines. The leftmost column depicts complex searches whereas the remaining columns depict the corresponding simple searches. The first two simple searches measure target-distracter similarity (TD1 and TD2, middle panels), and the last simple search (panels D and H) measures distracter-distracter similarity or distracter homogeneity (D1D2). Green asterisks represent statistical significance as before.

