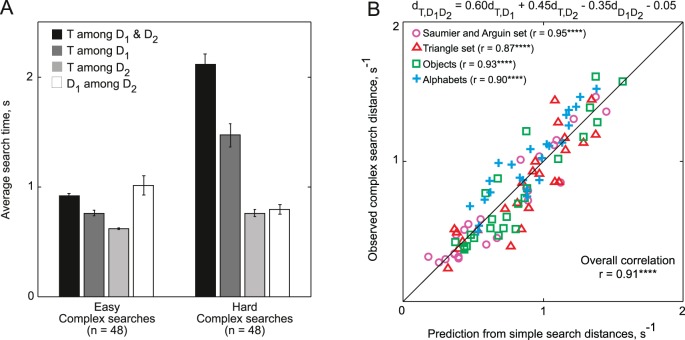
Figure 9.
(A) The 96 complex search times in Experiment 3 were sorted into 48 easy and 48 hard complex searches. For these two groups, the average complex search times and their corresponding simple search times are shown. Error bars represent SEM of the subject-averaged search times across conditions. It can be seen that easy complex searches involve smaller search times for (T, D1) and (T, D2) but larger search times for (D1, D2); this illustrates the opposite effect of distracter homogeneity. (B) Observed complex search distances (averaged across subjects) plotted against model predictions based on simple searches for Model 6. There were 24 complex searches in each set (eight subsets × three targets per subset). Model predictions were strongly correlated with the observed data and explained 83% of the total variance. Asterisks represent statistical significance (***** is p < 0.00005).

