
Figure 1.
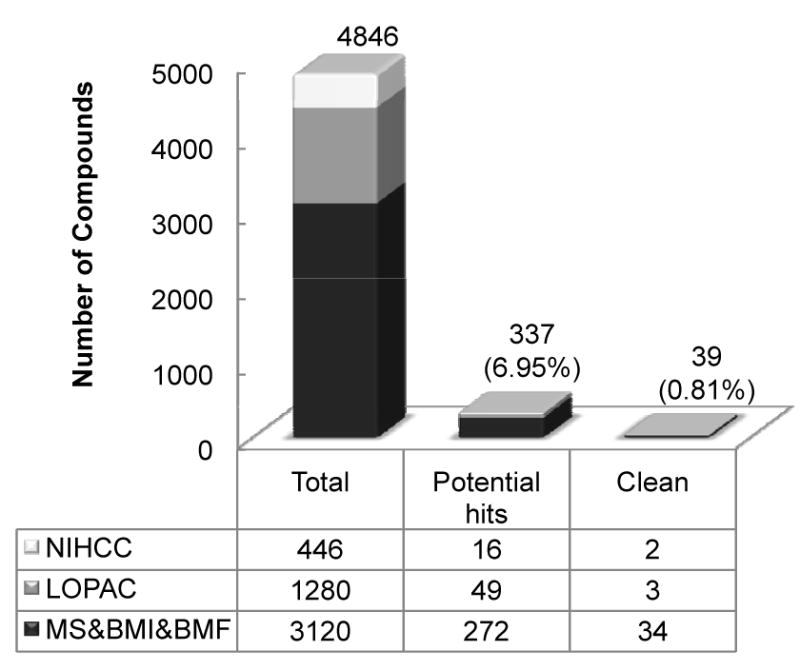
Summary of the HTS results. The contribution of each library to the total screened compounds, the potential hits and the clean hits is listed in the table. The total number of all libraries in each column is plotted above the table. The percentage of potential hits and clean hits is in parenthesis. The potential hits are screened compounds that have a minimum of 30% inhibitory effect at 10μM and the clean hits are those potential hits that are not cytotoxic or luciferase inhibitors.