
Figure 3.
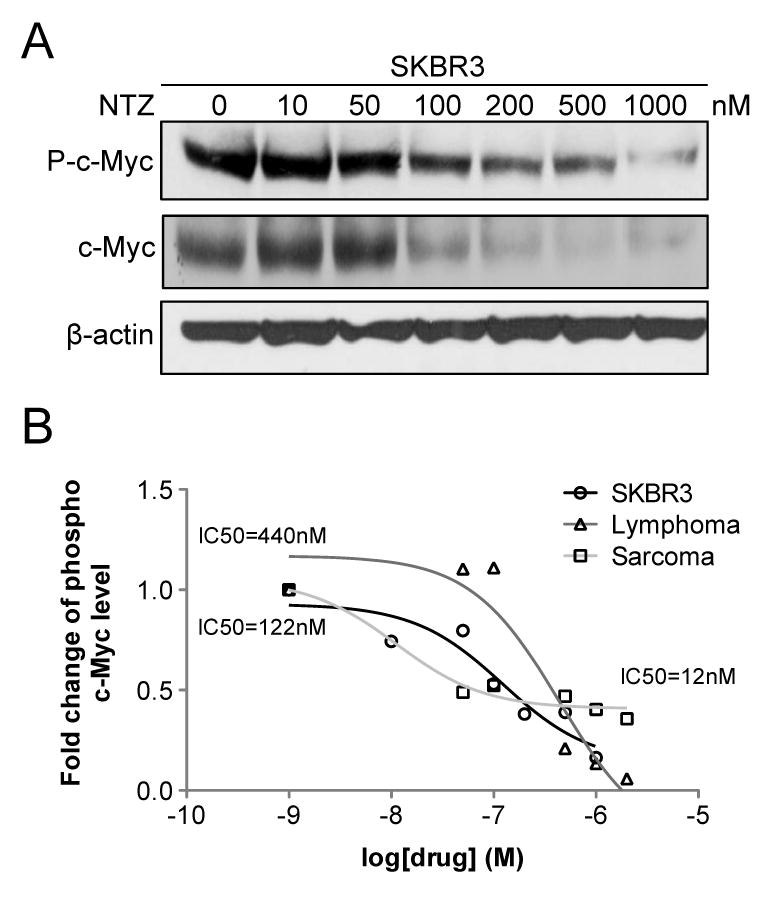
Inhibition of endogenous phosphorylation of c-Myc. (A) Western blot analysis of SKBR3 cells after NTZ treatment was performed using phospho c-Myc, c-Myc protein and β-actin antibodies. (B) NTZ induced dose dependent inhibition of phospho c-Myc level in all three tumor cell lines, SKBR3 (IC50=122nM), lymphoma (IC50=440nM) and sarcoma cells (IC50=12nM). The fold-change of phospho c-Myc level was plotted against the log scale of NTZ concentration.