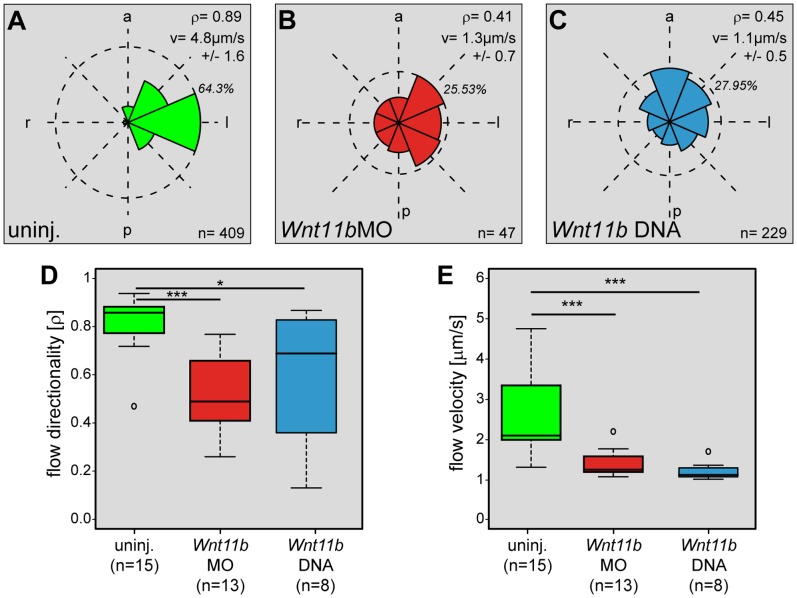
Figure 2. Wnt11b is required for leftward flow at the GRP.
Flow analysis in wildtype and manipulated specimens. (A–C) Frequency distribution of trajectory angles in representative explants of uninjected control embryos (uninj., A), Wnt11bMO (B) and Wnt11b DNA (C) injected specimens. Dashed circles indicate maximum frequency (in %), n represents the number of tracked particles above threshold. a = anterior, l = left, p = posterior, r = right, v = average velocity of particles, ρ = quality of flow. (D, E) Compiled results of all embryos analyzed for flow directionality (D) and velocity of fluorescent beads added to GRP explants at stage 17 (E). Note that both parameters were significantly reduced in Wnt11b morphants or Wnt11b DNA injected embryos. In (D, E), n represents number of analyzed explants. * Significant (p<0.05), ***Very highly significant (p<0.001), n = number of analyzed explants.

