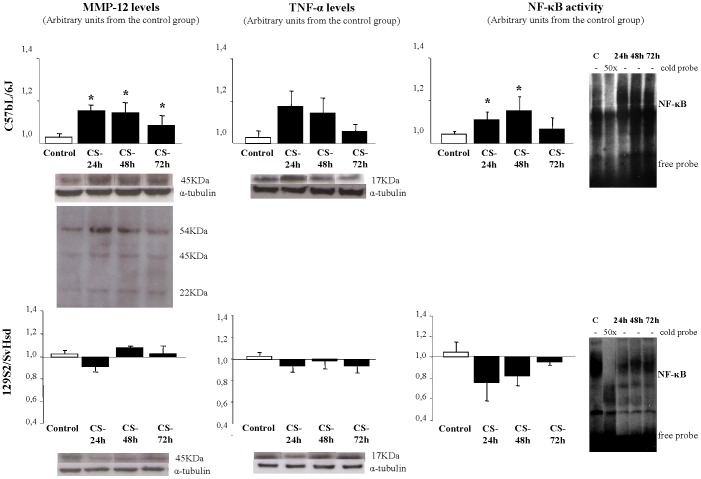
Figure 3. MMP-12, TNF-α levels and NF-kB activation after CS-induced inflammation.
Detection of MMP-12 and TNF-α protein levels by WB and NF-kB activation by EMSA in lung homogenates after CS exposure was performed. Specificity of the bands was confirmed by the disappearance of the bands with the addition of 50-fold excess of cold oligonucleotide (cold probe). Bands were measured by densitometric analysis and normalized with α-tubulin for WB. Results were expressed as mean ± SEM; *p<0.05; n = 8/group. (□) air exposed group; (▪) smoke-exposed group at 24, 48 and 72 h after CS exposure.

