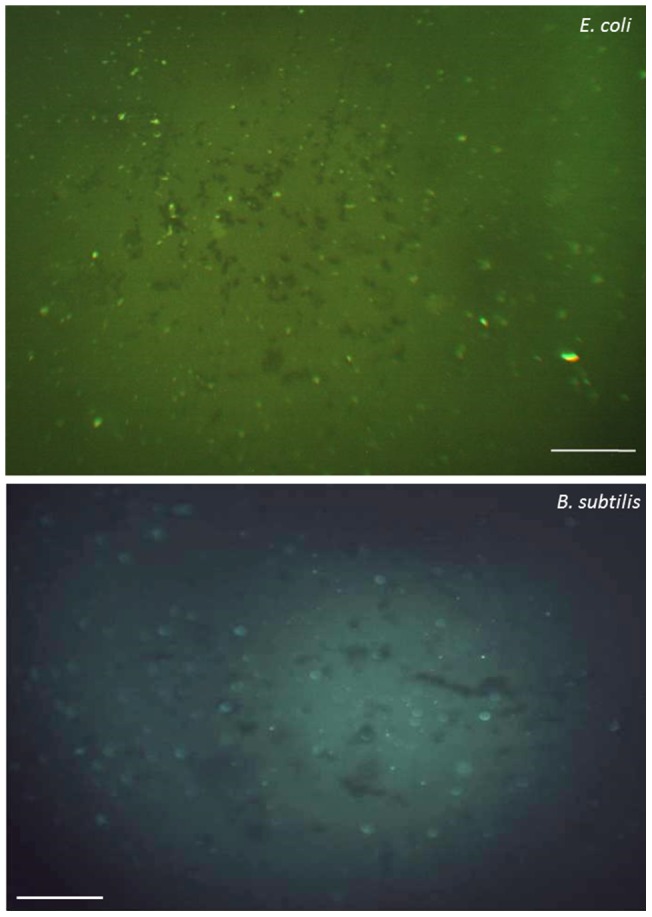
Figure 3. Binding of FITC-labeled Vg to E. coli (top) and B. subtilis.

After washing with 25mM Tris buffer, the microbes were applied to microscope slides and observed under an Olympus fluorescence microscope. Images from the BSA control were completely black. Scale bars 40µm. For brightfield images see Figure S3.
