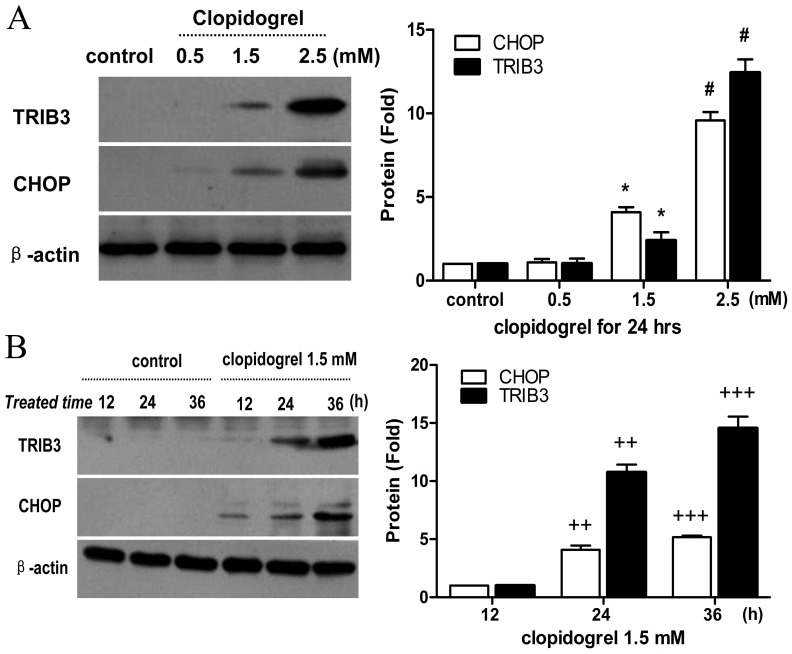
Figure 5. Effects of clopidogrel on CHOP and TRIB3 protein expression in the GES-1 cells.
The protein expression levels of both CHOP and TRIB3 were up-regulated in the GES-1 cells in a concentration- and time-dependent manner, consistent with their mRNA expression profiles as measured by real-time PCR. Data are a representative of three independent experiments. **P<0.05 vs vehicle control; #P<0.05 vs clopidogrel (1.5 mM); ++P<0.05 vs clopidogrel (1.5 mM for 12 h); +++P<0.05 vs clopidogrel (1.5 mM for 24 h).

