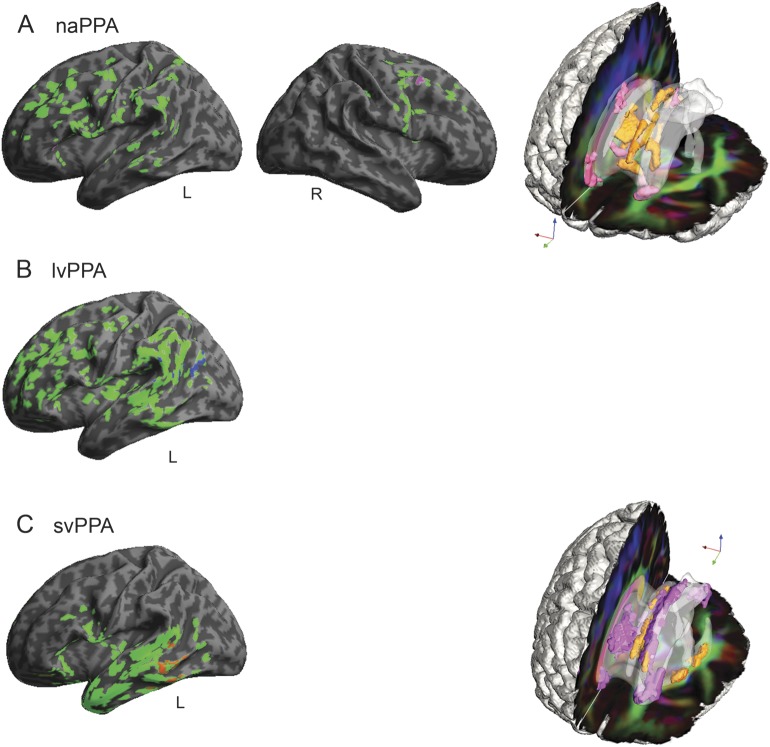
Figure 2. Regressions relating speech production variables to gray matter atrophy and reduced white matter fractional anisotropy in primary progressive aphasia.
(A) Regressions for speech errors per 100 words in nonfluent/agrammatic primary progressive aphasia (naPPA). (B) Regressions for dysfluencies per 100 words in logopenic variant primary progressive aphasia (lvPPA). (C) Regressions for nouns per 100 words in semantic variant primary progressive aphasia (svPPA). In the left (left hemisphere) and center (right hemisphere) columns, gray matter atrophy is shown in green (q < 0.025, FDR-corrected), and regressions are in other colors (p < 0.05). On the right, reduced white matter fractional anisotropy is shown in orange (q < 0.01, FDR-corrected, except svPPA p < 0.005 uncorrected), and regressions are shown in pink (p < 0.01). Right hemisphere gray matter atrophy is not shown in panels B and C and white matter reduced fractional anisotropy is not shown in panel B because there were no significant regression results. FDR = false discovery rate.

