
Figure 1. Relation of early- and late-life cognitive activity to cognitive decline.
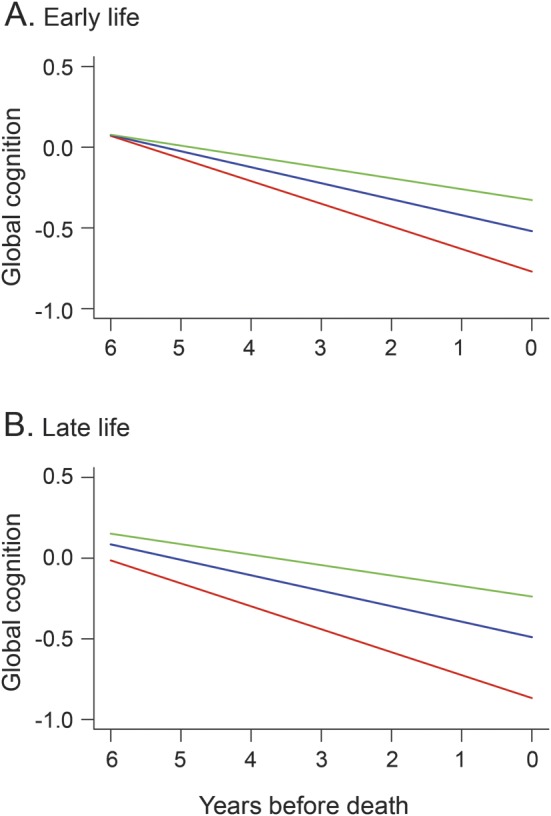
Predicted paths of change in global cognition during the last 6 years of life for persons with high (green line, 90th percentile), middle (blue line, 50th percentile), and low (red line, 10th percentile) cognitive activity in early life (A) and late life (B), adjusted for age at death, sex, education, plaques, tangles, infarction, and Lewy bodies.