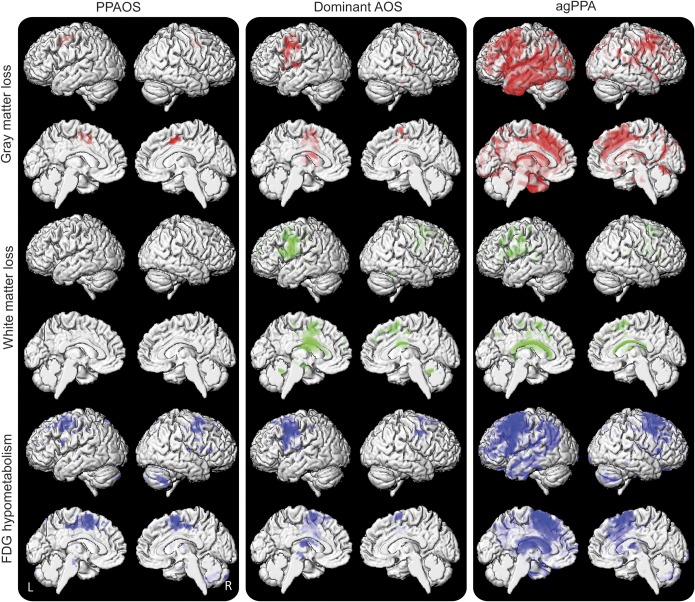
Figure 1. Three-dimensional renderings showing patterns of gray (in red) and white matter (in green) loss and FDG-PET hypometabolism (in blue) in each group compared with controls.
Gray and white matter results are shown after correction for multiple comparisons using the FDR at p < 0.005. No regions of FDG-PET hypometabolism survived correction at FDR p < 0.005 for PPAOS and dominant AOS, and therefore FDG-PET results are shown uncorrected for multiple comparisons at p < 0.001. agPPA = agrammatic primary progressive aphasia; AOS = apraxia of speech; FDG = F18-fluorodeoxyglucose; FDR = false discovery rate; PPAOS = primary progressive AOS.

