
Figure 2. Results of the TBSS analysis of FA.
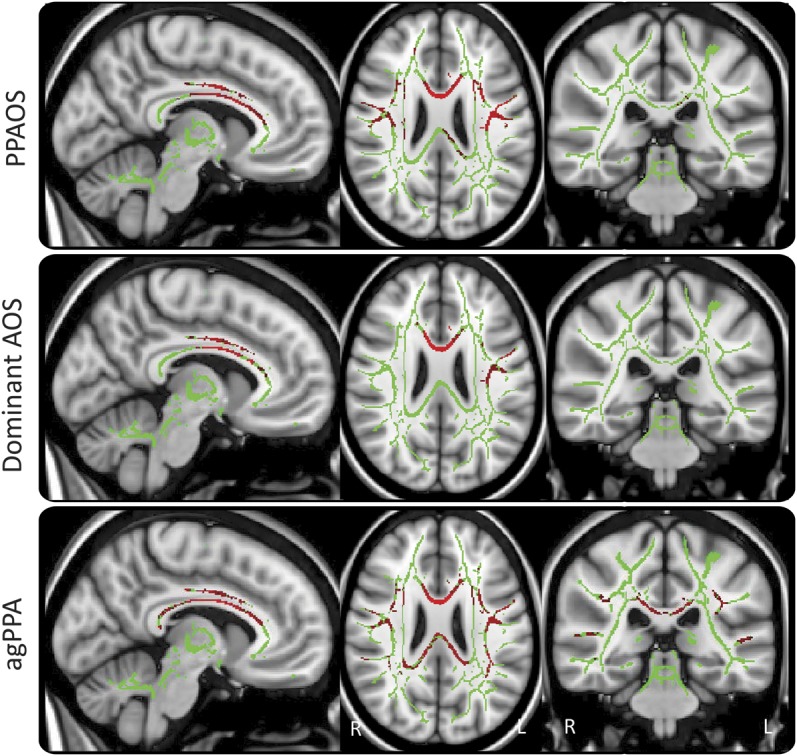
The mean FA skeleton is shown in green with red representing regions of reduced FA in PPAOS, dominant AOS, and agPPA compared with controls. Results were corrected for multiple comparisons at p < 0.05. agPPA = agrammatic primary progressive aphasia; AOS = apraxia of speech; FA = fractional anisotropy; PPAOS = primary progressive AOS; TBSS = Tract-Based Spatial Statistics.