
Figure 3. Calorimetry data for titration of CL (C14∶0).
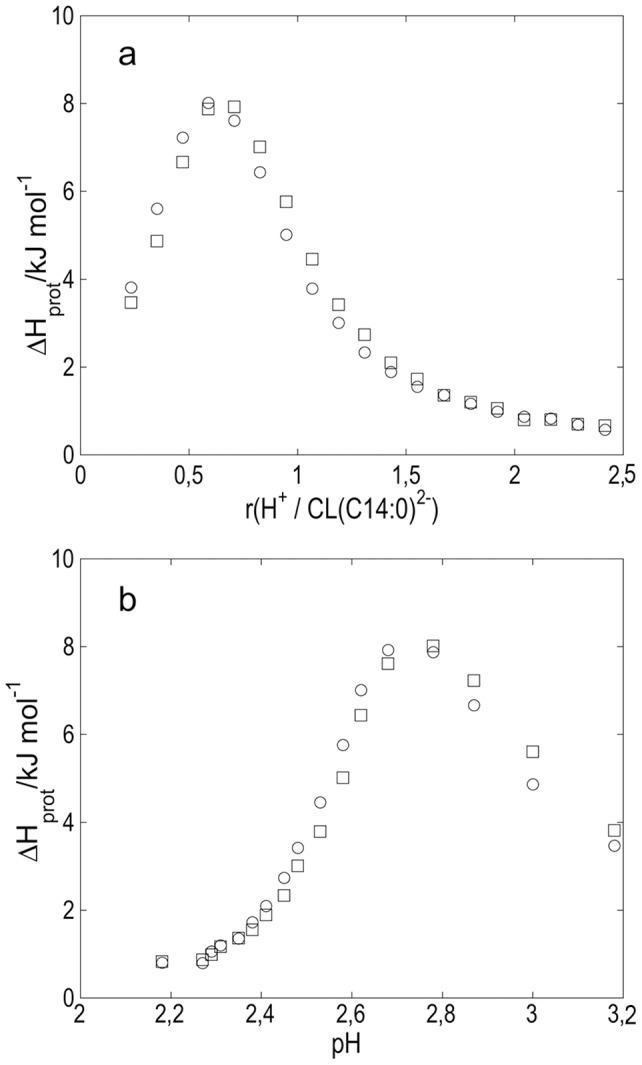
Enthalpy changes ΔHprot from addition of 5 µl portions of 0.05 mol l−1 HCl to 1.463 mmol l−1 dispersion of CL (C14∶0) Na2 plotted in a) as a function of mole ratio r{H+/CL (C14∶0)2−} and in b) as a function of pH. (two replicates).