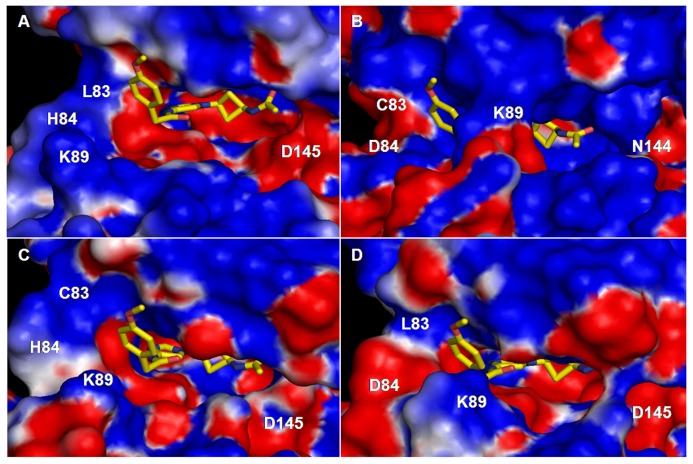
Figure 8. Electrostatic potential maps the substrate binding pocket of CDKs.
Potential maps are generated for cis-N-acetyl bound (A) CDK2 (B) CDK5 (C) CDK2:L83C mutant, and (D) CDK2:H84D mutant. Red and blue represent electronegative and electropositive potentials, respectively. The inhibitor is also shown.

