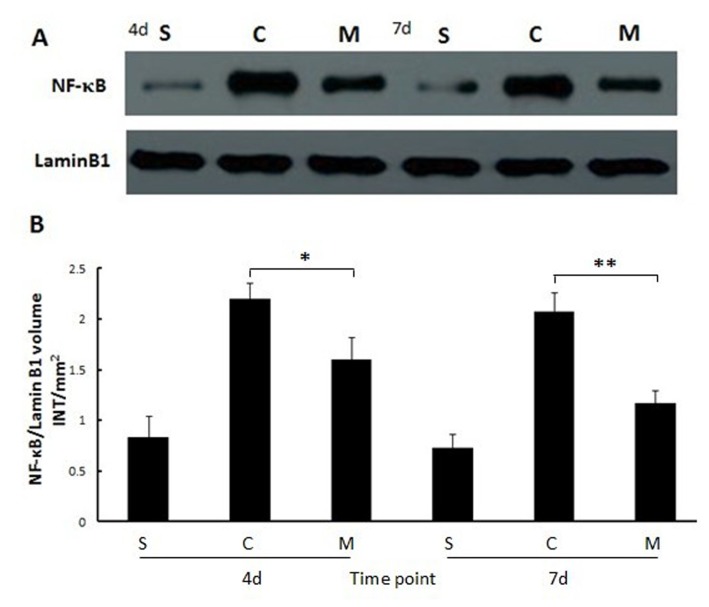
Figure 5. Mucosal NF-κB expression in each group at 4 and 7 days after MSCs administered.
(A) Semiquantitative assessment of bands for NF-κB and its internal control protein. (B) Values of the NF-κB band performed densitometrically using the software Quantity One. Each bar represents the mean ± SD of the different groups; values were compared by one-way ANOVA test, **: P<0.01, *: P<0.05. S: sham group; C: control (saline) group; M: MSCs group. 4d and 7d represent 4 days and 7 days postoperatively.

