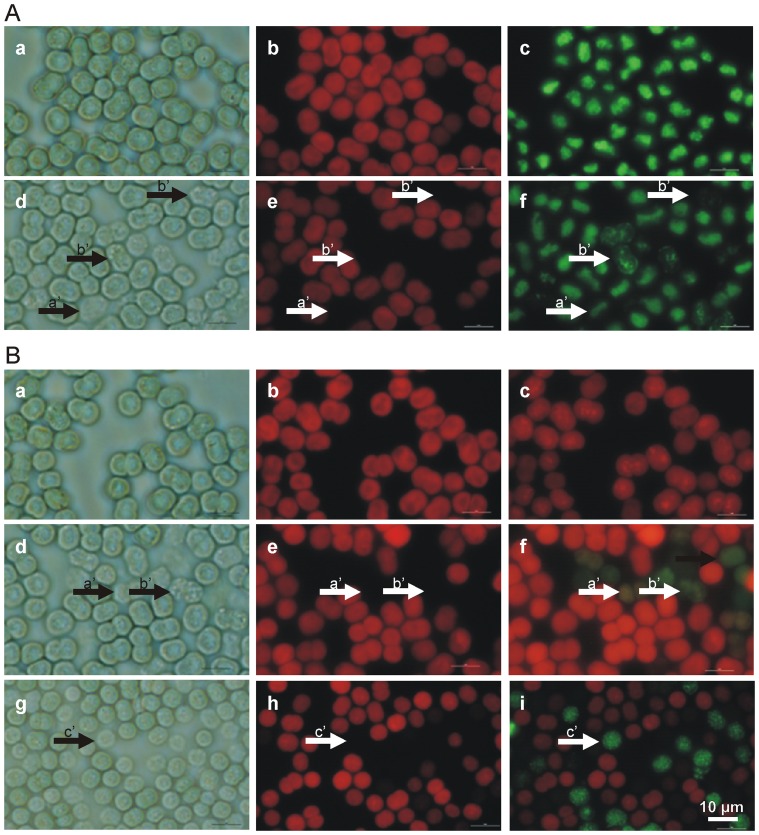
Figure 3. Study of both MC non-producing (PCC7005) and MC-producing (PCC7806) M. aeruginosa strains exposed to UVB radiation for three hours at the intensity of 0.995 W/m2.
Panel A. Upper row, control MC non-producing PAR acclimated PCC7005 strain, middle row - PCC7806 strain exposed to UVB radiation and lower row – PCC7005 strain exposed to UVB radiation. Microphotographs of the same area of M. aeruginosa cells taken under light microscopy (Images a, d and g), autofluorescence (Images b, e and h) and SYBR Green DNA staining (Images c, f and i). Control cells in the upper row show normal cell morphology (Image a) with homogeneous autofluorescence (Image b), and compact nucleoids (Image c). Middle row - Twentyfour hours after UVB exposure the majority of PCC7806 cells udergo the process of lysis (Image d), with reduced autofluorescence (Image e). The degree of autofluorescence was estimated by using exposure times (Image b 83 ms; Image e 83 ms; Inset Image e 833 ms and Image h 917 ms). Inset in Image e is a microphotograph of the same area of cells taken at an extended exposure time. SYBR Green staining reveals complete degradation of the genetic material 24 hours after exposure expressed also as a weak signal (Image c – control cells, exposure time 250 ms; Image f – PCC7806, 250 ms and Image I – PCC7005, 917 ms). Scale bar = 5 µm. Panel B. Macroscopic representation of the three M. aeruginosa cell strains exposed to UVB radiation for three hours at an intensity of 0.995 W/m2. Cell cultures in Petri dishes immediately after UVB exposure (Image a), in cell culture flasks after being returned to the solar day/night cycle for 24 hours (Image b) and after a 20-day exposure to PAR (Image c) (control cells to the left, MC producing PCC7806 in the middle and MC non-producing PCC7005 to the right on all images).

