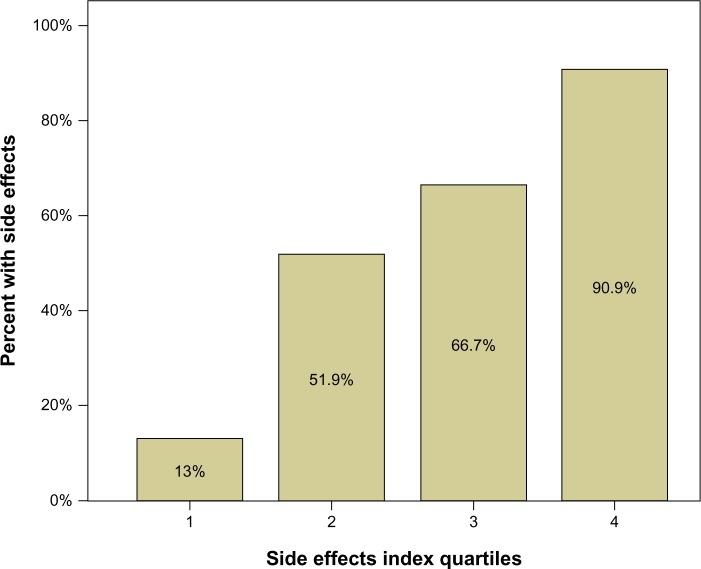
Figure 1.
Percent of side effects in each quartile group. The number of patients in each quartile group (1, 2, 3, 4) was 17 or 18. The figure indicates that among the 18 patients with lowest scores on the side-effects index scale, only 13% had side effects. Among the 18 patients with highest scores, 91% had side effects.
Note: Side effects index quartiles are based on the three variables that were statistical significant in the multivariate logistic regression model predicting side effects.

