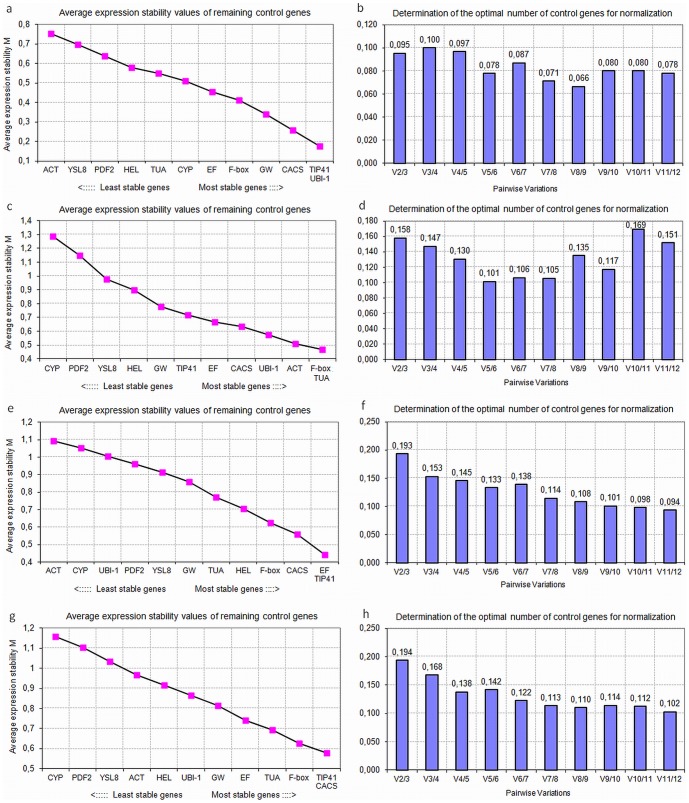
Figure 2. GeNorm based evaluation of candidate gene expression in samples from plants grown in different nitrate supply.
Average expression stability values (M) of the remaining candidate cucumber reference genes during stepwise exclusion of the least stable reference gene in roots (a), stems (c), leaves (e) and all cucumbers organs taken together (g). The lowest the M values indicate the most stable expression of candidate cucumber genes. Determination of optimal number of reference genes based on pairwise variation (V) analysis of normalization factors of the candidate reference genes in roots (b), stems (d), leaves (f) and all cucumber organs taken together (h). The Vn/n+1 value was calculated for every comparison between two of the twelve consecutive candidate reference genes. According to [14], additional (n+1)th reference gene should be included into analysis whenever the Vn/n+1 value drops below the 0.15 threshold.

