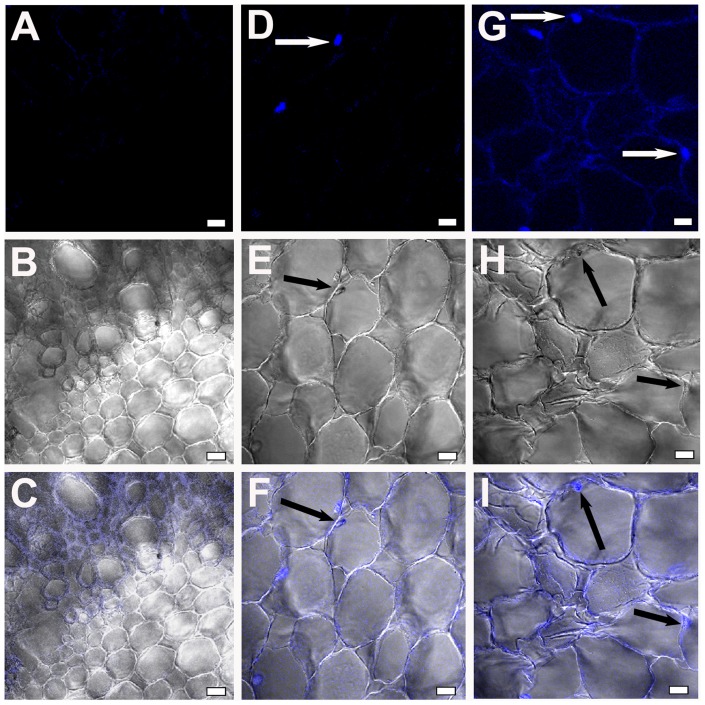
Figure 2. Confocal scanning laser microscopic images showing Foc1 progression and colonization in roots of WR315plants.
(A–C) correspond to root sections of uninduced plants. (D–F) represent root sections of WR315 after 7dpi; (G–I) showing root sections after 12dpi. A, D, G represent fluorescent images; B, E, H represent DIC images and C, F, I represent merged images. Bars represent 20 µm.

