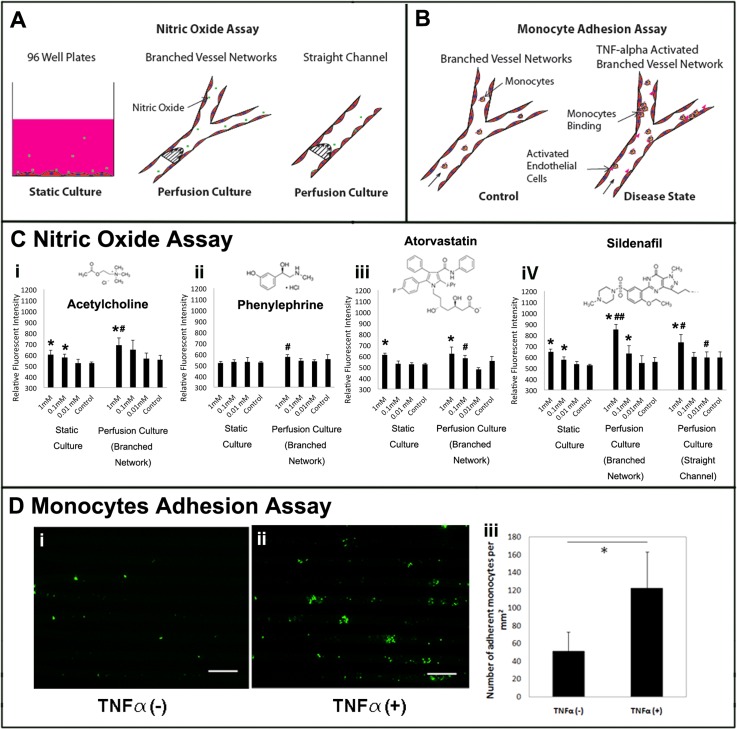
Figure 3.
Drug induced nitric oxide and monocyte adhesion assay. (a) Schematic of the experimental conditions of the nitric oxide assay. (b) Schematic of the experimental conditions of the monocytes adhesion assay. (c (i–iv)) Nitric oxide in static culture (n = 6) and perfusion culture in both branched circular channels and rectangular straight channels (n = 3) with quantitative fluorometric extracellular nitric oxide assay. * indicates a significant difference compared to the drug-free control at the same culture condition with p < 0.05. # indicates a significant difference in comparison to the corresponding static culture condition with p < 0.05. ## indicates significant additive interaction between culture conditions and drug concentrations. (d(i,ii)) Representative images of adherent monocytes within the micro-vessel network. Monocytes were labeled green. Scale bar, 300 μm. (d(iii)) Quantification of adherent monocytes density within micro-vessel networks, n = 3.

