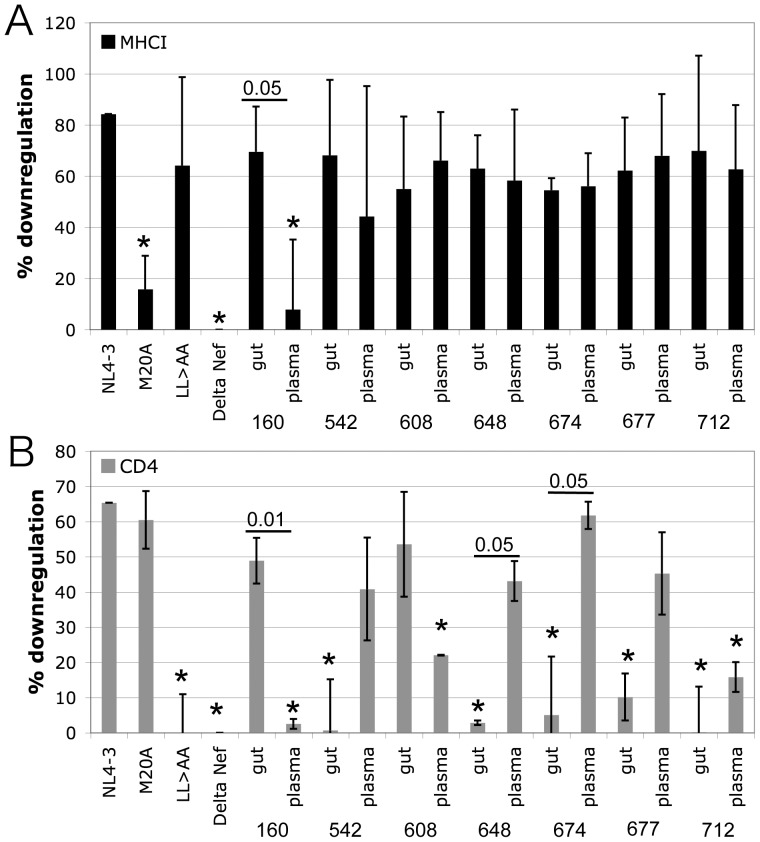
Figure 3. Summary of MHC Class I and CD4 downregulation.
The mean and standard deviation of HLA-A*02 (A) and CD4 (B) downregulation by control and subject-derived nef alleles from at least three separate infections is shown. Difference from % downregulation by NL4-3 Nef was evaluated with a two-tailed t test, and differences with a p-value <0.05 are marked with an *. Differences between gut and plasma quasispecies from the same subject were also evaluated with a two-tailed t test, and pairs with significant differences are marked with a horizontal bar with the p-value indicated above the bar.

