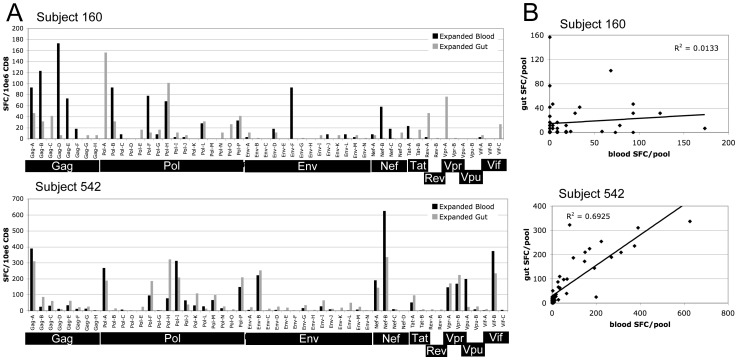
Figure 4. Comparison of CTL responses by CD8+ lymphocytes from PBMC and MMC from gut biopsy specimens.
HIV-specific CTL responses were mapped by IFN-gamma ELISpot using expanded CD8+ lymphocytes and pools of Clade B consensus peptides covering the entire HIV proteome. CTL mapping was performed twice with blood and gut biopsy specimens collected on separate visits about 2 weeks apart. A.) ELISpot results showing the mean number of Spot Forming Cells (SFC) per million CD8+ cells for each of the 53 peptide pools. Subject 160 is representative of the 2 subjects with discordant responses in blood and gut. Subject 542 is representative of the remaining 6 subjects with concordant responses. B.) X-Y scatter plot of mean blood vs. gut CTL responses for the same subjects as in A. Regression lines and R2 values are shown. The p-value for the positive concordance seen for subject 542 is <0.001. See Table 3 for a summary of all correlation coefficients and p-values for each subject.

