
Figure 6. Amount of selective pressure correlates with the CTL response regardless of location.
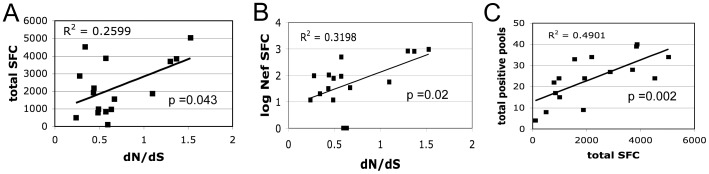
Regression analysis shows a statistically significant correlation between the total mean number of SFC and the estimated global dN/dS from all samples, both blood and gut, for each subject (A). The correlation between CTL and dN/dS from all samples is more significant if only Nef-specific SFCs are considered (B). Finally, there is a significant correlation between the total mean number of SFCs and the number of positive peptide pools (C).