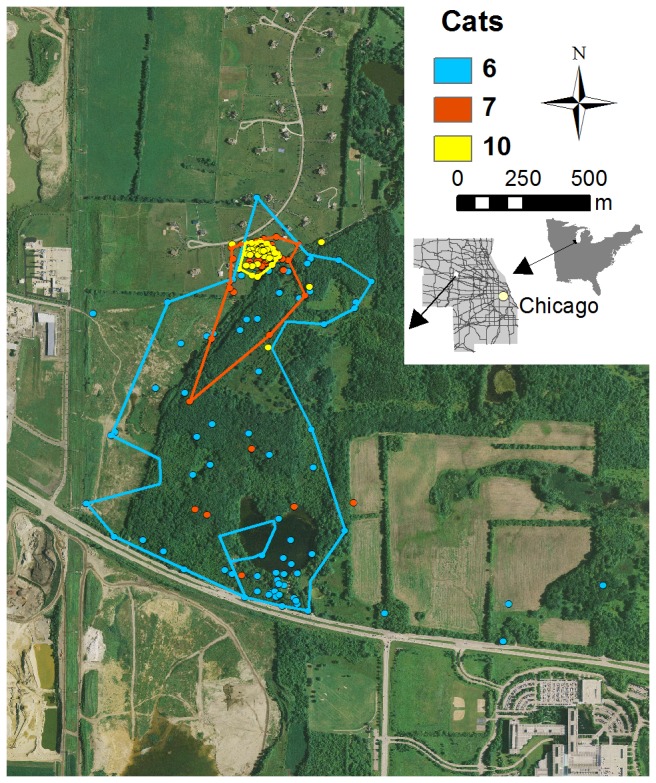
Figure 3. Annual home ranges (95% Local Convex Hull) of free-roaming cats.

Relocations occurred during 2008 in the Chicago metropolitan area, and illustrates the individual variation in home range size among cats using the same area. Grey lines on the county map indicate roads.
