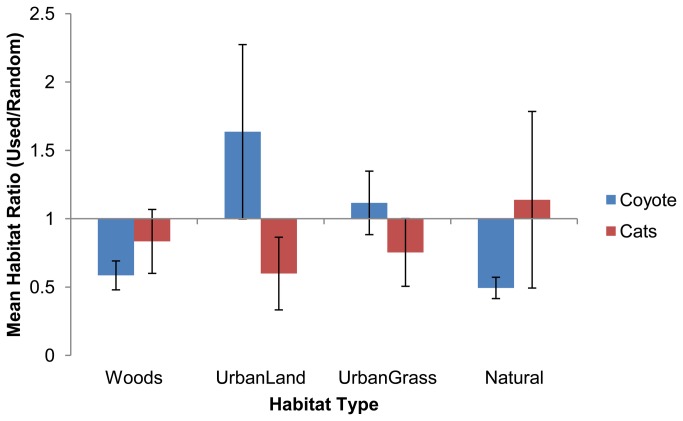
Figure 4. Mean (95% CI) habitat selection ratios for coyotes and free-roaming cats in the Chicago metropolitan area during 2008-2009.
Selection ratios are the ratio of the distance to habitat type for observed locations/random locations. Ratios <1 indicate selection for the habitat, and >1 avoidance.

