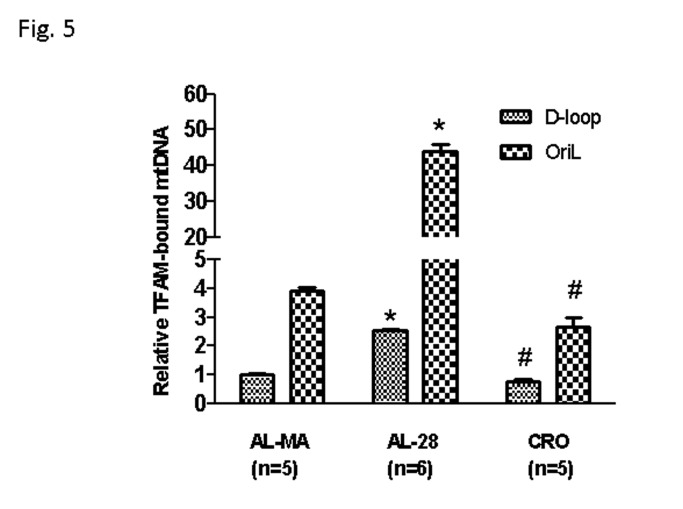
Figure 5. Age- and calorie restriction-related changes of TFAM-bound mtDNA amount at two mtDNA regions by RT-PCR.
An age-related increase in the amount of TFAM-bound mtDNA was found at both assayed regions, while it was prevented by CR. The amplified products enclose sections, respectively, of the D-loop region and of the OriL region delimited by the primers pairs listed in the bottom part of Table 1. The calculation of the relative amount of TFAM-bound mtDNA was performed according to the formula 2ΔCTx -2ΔCTb, where ΔCTx is the CT difference between the CT values of the input and of the immunoprecipitated sample and ΔCTb is the CT difference between the CT values of the input and of the –Ab sample. The obtained results were then normalized with respect to the mean value of TFAM-bound mtDNA in the D-loop region from AL-MA animals (fixed as 1). Bars represent the mean (+/- SD) of the relative amounts of TFAM-bound mtDNA derived from each of the assayed animals in the specific group. *p<0.05 versus the value of the AL-MA rats; # p<0.05 versus the amount from the same region of AL-28 rats; n=number of analyzed animals.

