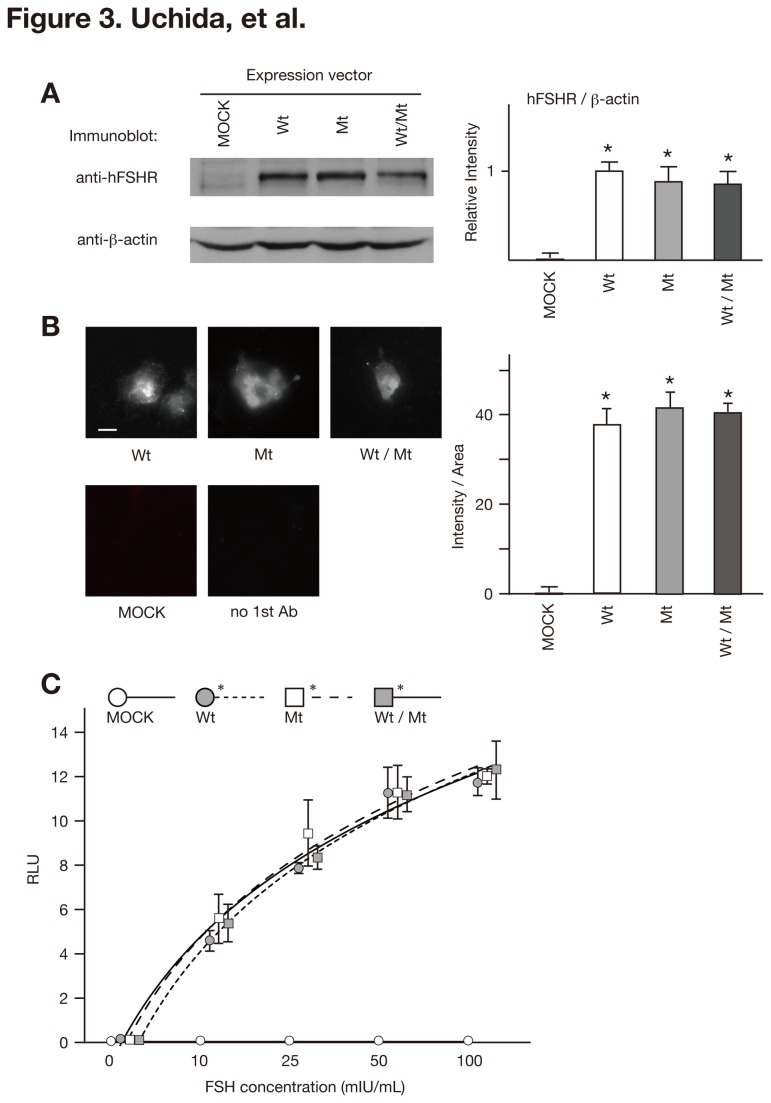
Figure 3. Luciferase activities of FSHRwt, FSHRmt, and FSHRwt/mt cells following treatment with FSH.
(A) Immunoblot analysis of FSHR immunoprecipitates (upper panel) and total cell lysates (lower panel) derived from 293T cells transfected with empty vector (MOCK), pcFSHRwt (Wt), pcFSHRmt (Mt), or an equal mixture of pcFSHRwt and pcFSHRmt (Wt/Mt) using the indicated antibodies. The band intensity of FSHR was quantified using ImageJ® software (http://rsbweb.nih.gov/ij/). Data are expressed as the mean ± SEM, and the relative intensity of FSHRwt cells was set at 1.0. There were no significant differences in the band intensity among FSHRwt, FSRmt, and FSHwt/mt cells. (B) Immunofluorescent signal of FSHR expressed at the cell surface was obtained from 293T cells transfected with the indicated vector and stained with anti-FSHR antibody without permeabilization. Bar, 20µm. Intensity of fluorescent signal was measured with ImageJ® software and divided by cell body area. Data expressed the mean ± SEM. There were no significant differences in the band intensity among FSHRwt, FSRmt, and FSHwt/mt cells. (C) Luciferase assay. MOCK, FSHRwt, FSHRmt, and FSHRwt/mt cells were treated with 0, 10, 25, 50, or 100 mIU/mL recombinant human FSH and subjected to a luciferase assay. Firefly luciferase activities were normalized with the sea pansy luciferase activities, and described as relative light units (RLU). Each bar indicates the mean ± SEM, obtained from three different independent experiments. Asterisks show the significant difference of each fitted curve compared to MOCK cells (P<0.05).

