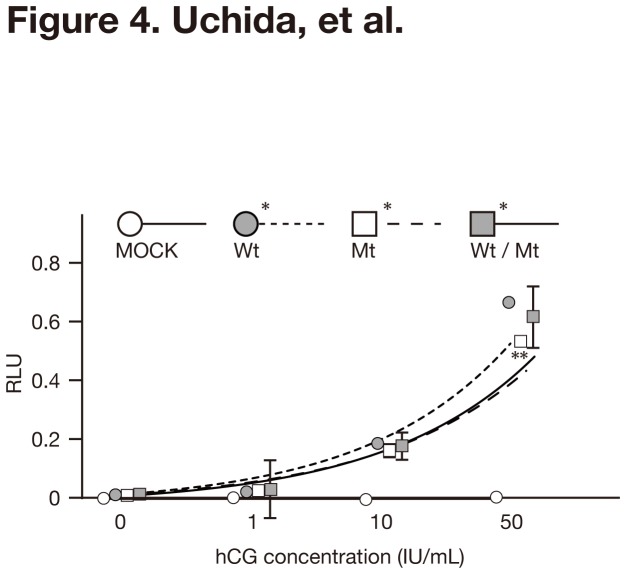
Figure 4. Luciferase activities of FSHRwt, FSHRmt, and FSHRwt/mt cells following treatment with hCG.
MOCK, FSHRwt, FSHRmt, and FSHRwt/mt cells were treated with 0, 1, 10, 50 IU/mL hCG and subjected to a luciferase assay. Firefly luciferase activities were normalized with the sea pansy luciferase activities, and described as relative light units (RLU). Each bar indicates the mean ± SEM, obtained from three different independent experiments. Asterisks show the significant difference of each fitted curve compared to MOCK cells. A double-asterisk shows the significant difference compared to FSHRwt cells treated with 50 IU/mL hCG (P<0.05).

