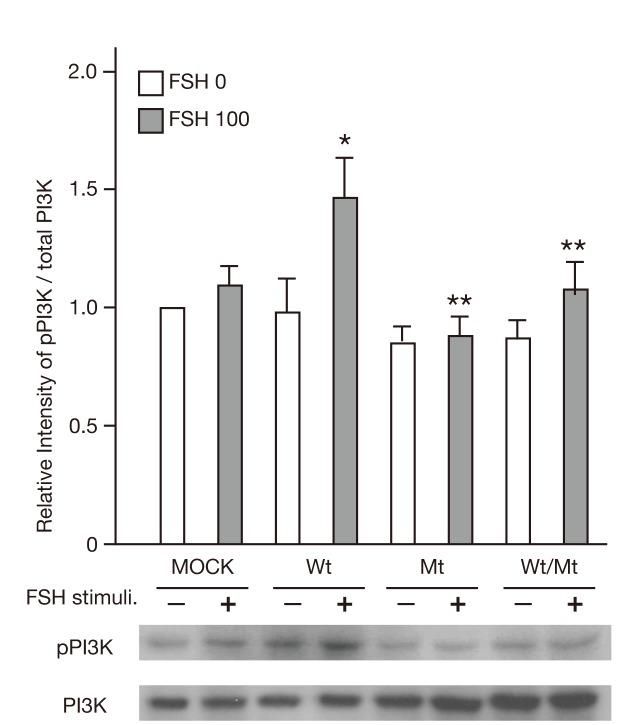
Figure 7. Phosphorylation of PI3K in FSHRwt, FSHRmt, and FSHRwt/mt cells following treatment with FSH.
Phosphorylation of PI3K p85 in 293T cells transfected with empty vector, FSHRwt, FSHRmt, or FSHRwt/mt followed by treatment without (FSH 0) and with 100 mIU/mL FSH (FSH 100) were analyzed by immunoblotting using antibodies against phospho-PI3K p85 and total PI3K p85. Each band was quantified with ImageJ® software. Phosphorylation level of PI3K p85 was normalized to the intensity of the total PI3K p85 expression band. Data express the mean ± SEM, obtained from three independent experiments. Single and double asterisks show the significant difference compared to FSHRwt cells treated without and with FSH, respectively (P <0.05).

