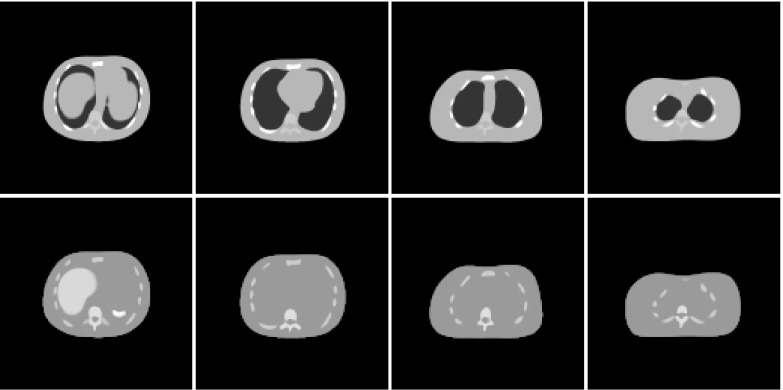
Figure 1.
Physical density (top) and NeoTect distribution (bottom) in four transverse slices from the NCAT phantom. Differences in NeoTect uptake have been compressed to enhance visibility. The slice at left includes portions of the liver, spleen, stomach, and heart. The other slices are progressively higher in the torso. The lungs are the dark regions within the torso in the density images.

