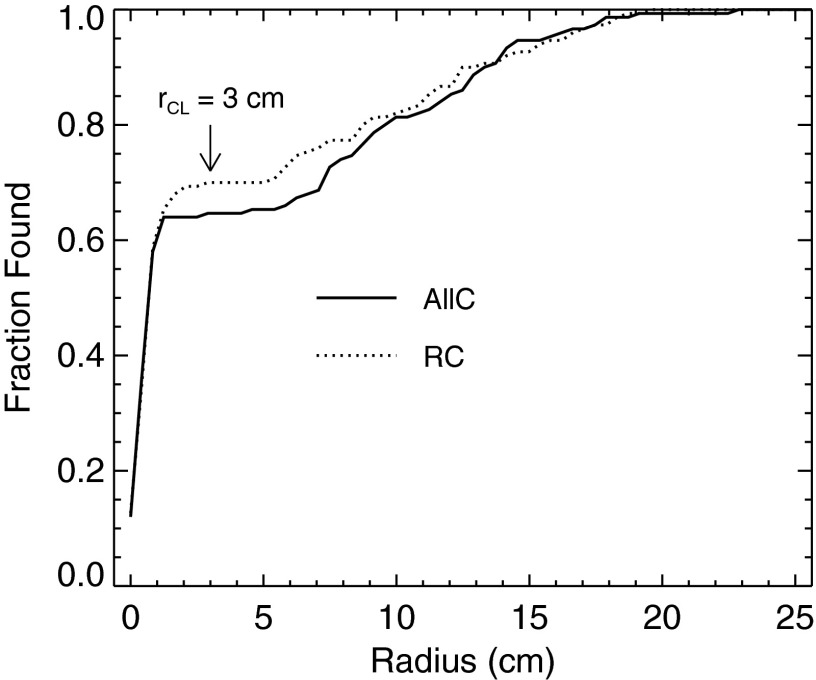
Figure 6.
Establishing the radius of correct localization rCL from the human-observer data. The fraction of lesions found for a given strategy is plotted as a function of the proposed radius. The localization data from the three observers were pooled for this analysis, yielding 150 localizations (3 × 50 abnormal volumes) per strategy. The selected value of rCL is indicated by the arrow.

