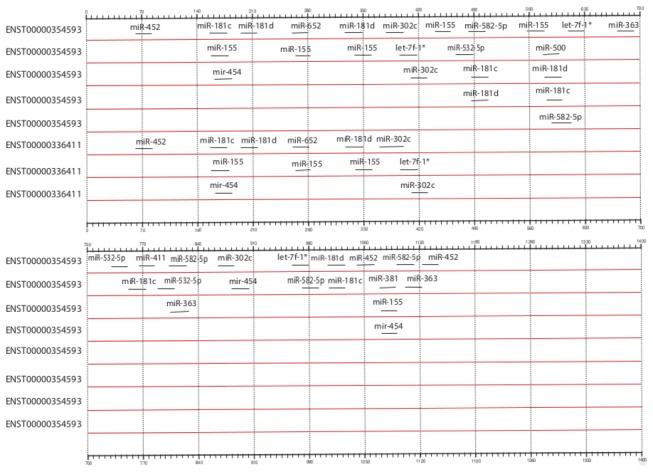
Figure 3. Block diagram showing the distribution of miRNA binding sites in the 3’ Untranslated regions (UTR) of the CYP3A4 transcripts.

UTR regions of the both the transcripts ENST00000354593 (length 1172 bp) and ENST00000336411 (474 bp) are aligned to the left and shown from 5’ to 3’ orientation. When multiple miRNAs were found to overlap in their binding locations on the respective transcripts, different tracks are used to improve the layout.
