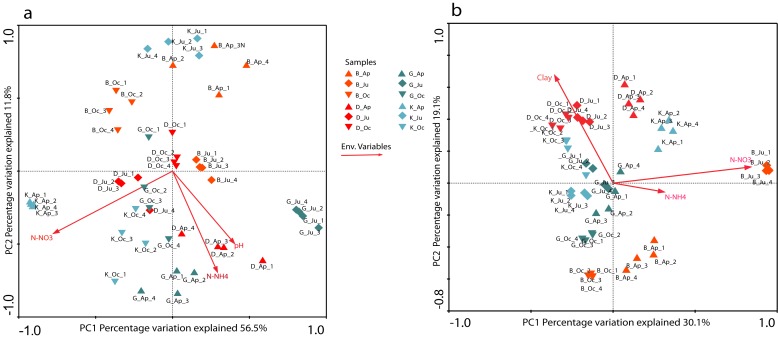
Figure 2. Changes in the structure of total bacterial and N-fixing communities from DGGE fingerprints across different soils and sampling times.
Changes in the structure of bacterial (a) and N-fixing (b) communities and the influence of environmental parameters, as revealed by CCA. Only statistically significant environmental variables are shown. The number in each axis shows the percentage of total variation explained. The length of the corresponding arrows indicated the relative importance of the geochemical factor in explaining the variation in microbial profiles. Soil samples were analyzed in four replicates at each sampling time. B, Buinen; D, Droevendaal; K, Kollumerwaard and G, Grebbedijk; Ap, April; Ju, June; Oc, October.

