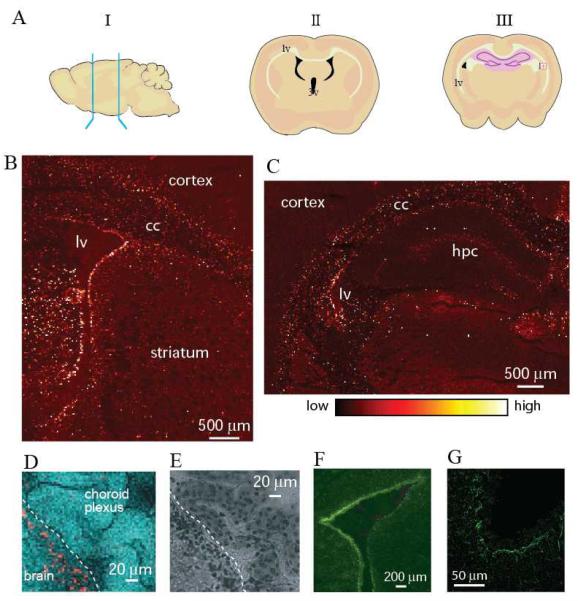
Figure 1.
A. Schematic sagittal and coronal views of a rodent brain showing the area of the brain where sections were collected. The lateral (lv) and third (3v) ventricles are depicted in black. The ventricles contain cerebrospinal fluid (CSF) and cells of the choroid plexus comprising the blood-CSF barrier. B. Cu Kα fluorescence map of a rat coronal section at bregma = −0.8. C. Cu K α fluorescence map of a rat coronal section at bregma = −2.56. D. Coronal section of a rat brain recorded with increased resolution along the ventricle wall showing that the Cu signal in the SVZ has a highly uneven intensity suggesting subcellular Cu localization. Cu Kα fluorescence is shown in red while Compton scattering is in cyan. The white dashed line indicates the ventricle wall. Experimental details are shown in Table 1. Similar distributions were observed in all wild type animals used in this study (6 mice and 10 rats). E. Image of the same section as in Fig. 1D after XRF analysis at room temperature stained with cresyl violet demonstrates tissue integrity after exposure to X-rays. F. Fluorescence microscopy image of the adjunct coronal section treated with the antibody to glial fibrillary acidic protein (GFAP), a marker of astrocytes. G. Fluorescence microscopy image of the SVZ treated with the antibody to Metallothionein I,II (MT).

