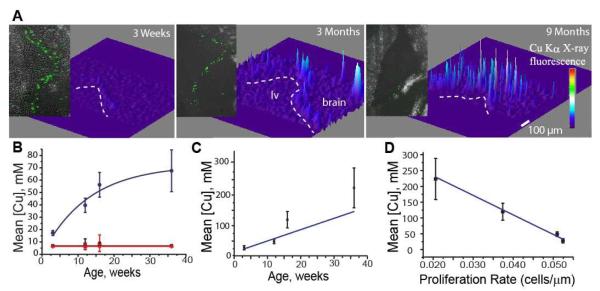
Figure 4.
A. 3D visualization of normalized Cu Ka fluorescence demonstrates an increased copper signal along the lateral ventricle (lv) wall (indicated by the white line) with increased age. Data were obtained from 30 mm thick coronal sections of the brains of 3 weeks, 3 months and 9 months-old rats. Similar distributions were observed in all 9 animals (3 in each age group) used in this study. Experimental details are shown in Table 1. Insets show visualization of Ki67 proliferation marker. B. Circles (blue): Mean Cu concentration in the SVZ as a function of age. Solid line shows fit to monomolecular growth model (R2 = 0.944). Squares (black): Mean Cu concentrations in the cortex of the brain. Triangles (red): Mean Cu concentrations of a half-brain coronal section. The solid line in the latter two cases shows a linear regression. It is apparent from this plot that Cu accumulation in the brain happens largely in the SVZ throughout aging. C. Cu concentrations in the SVZ Cu hotspots determined by median thresholding. The linearity may suggest that Cu accumulation above baseline levels is carried out by a mechanism which does not change its deposition rate with time (R2 = 0.56). D. Correlation between the Cu concentrations in the SVZ Cu hotspots and proliferation rate (r = −0.99).

