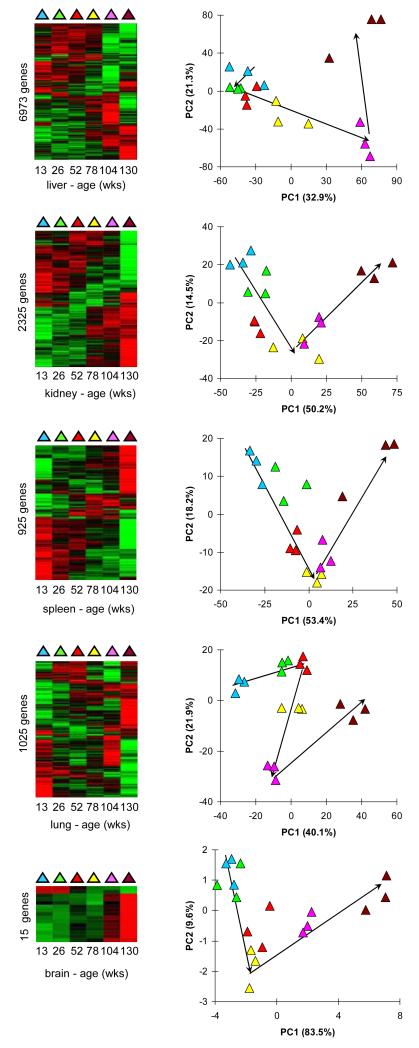
Figure 3. Age-related gene expression.
Differentially expressed genes (DEGs) in chronological aging. The first column shows heatmaps after clustering of the DEGs. The second column shows PCA of the gene expression values from the DEGs. The colors indicate chronological age according to the first column.

