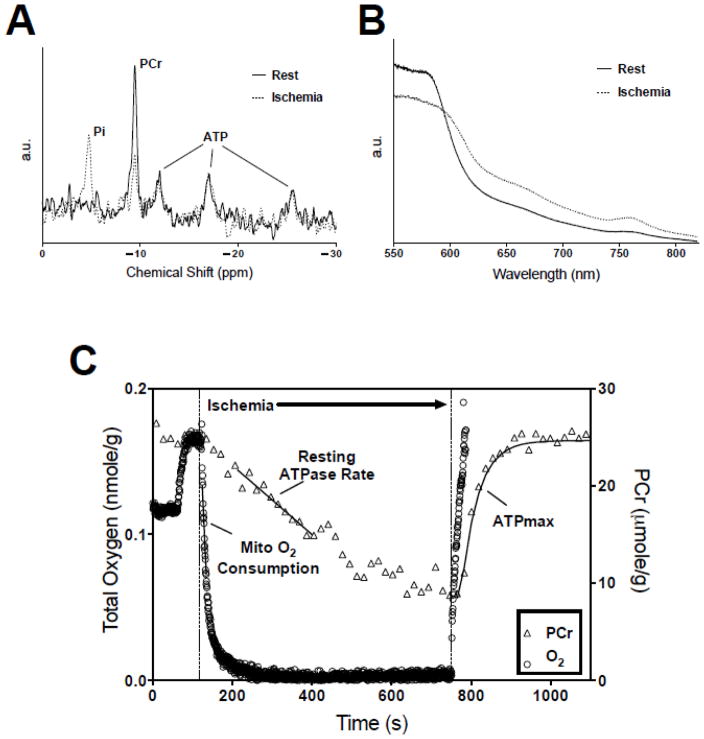
Figure 1.
(A) Representative in vivo 31P MR spectra acquired during dynamic experiment following 20 Hz line-broadening and summing 3 consecutive FIDs. (B) Representative in vivo NIR optical spectra acquired during dynamic experiment. (C) Analysis of dynamic in vivo spectra in conjunction with biochemical measures of hemoglobin, myoglobin, and ATP yields a noninvasive assessment of mitochondrial O2 consumption, resting ATP demand (ATPase) rate, and oxidative phosphorylation capacity (ATPmax). Total O2 content on the left axis and PCr concentration on the right.

