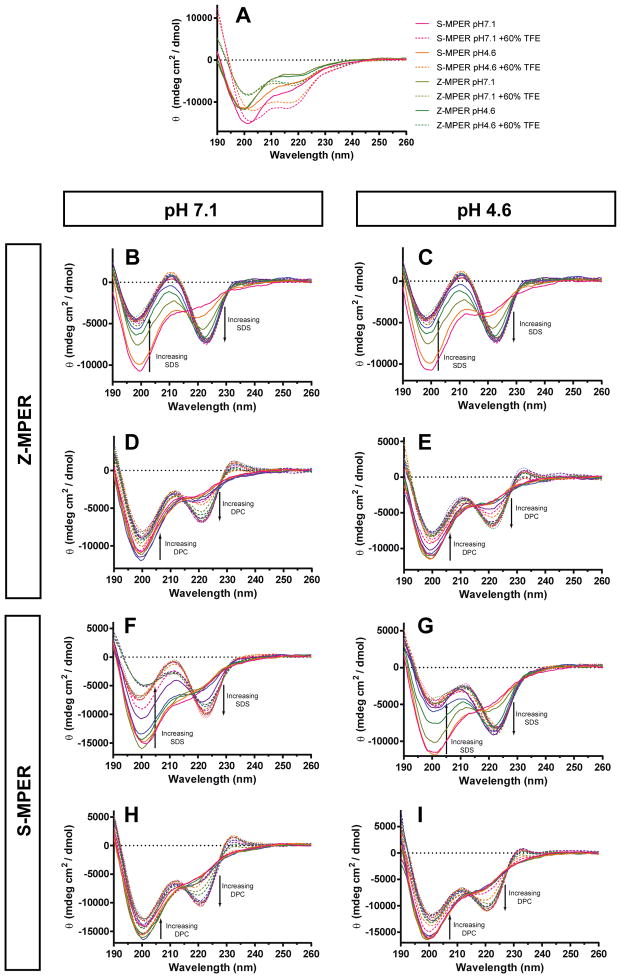
Figure 2.
CD spectra of Z-MPER and S-MPER in various conditions. (A) Peptides with or without 60% TFE. (B – E) Z-MPER titrations with SDS (B and C) or DPC (D and E) pH 4.6 and 7.1. Data were acquired in SDS concentrations up to 10mM in 0.5mM increments, and in DPC concentrations up to 2mM in 0.1mM increments. (F – I) Similar analysis of S-MPER.

