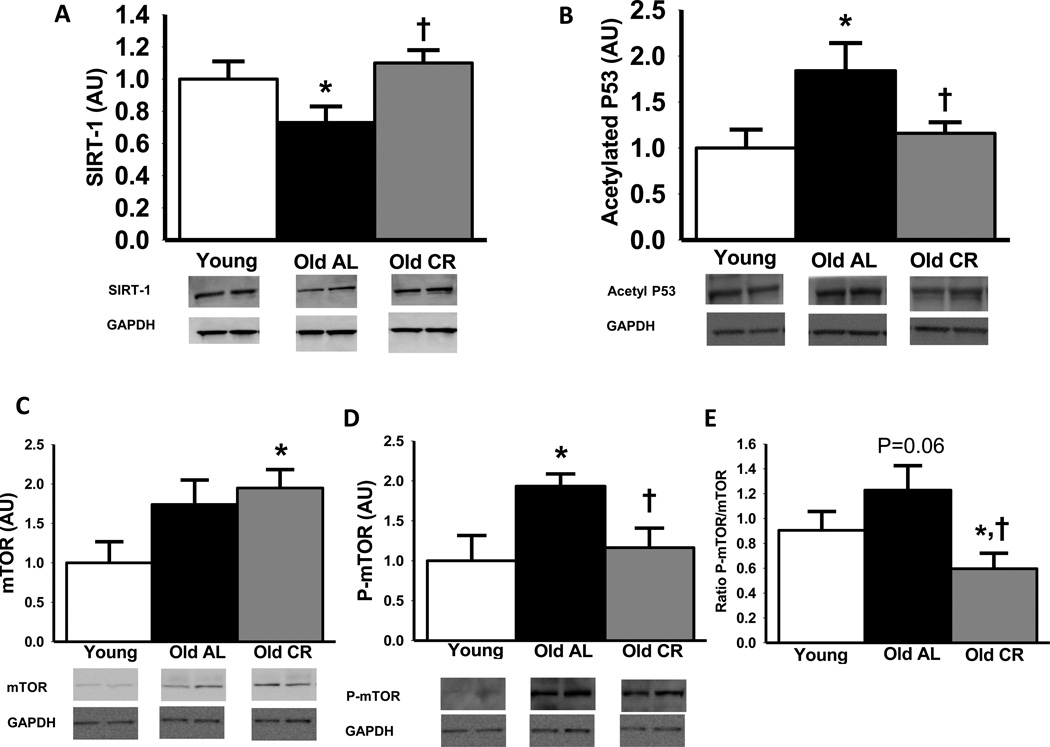
Figure 6.
Aortic sirtuin (SIRT)-1 (A), acetylated P53 (B), total mammalian target of rapamycin (mTOR; C), Ser2448- phosphorylated mTOR (D) and ratio of total to phosphorylated mTOR (E) protein expression from young and old ad libitum (AL) and old life-long caloric restricted (CR) B6D2F1 mice (n = 6–11 per group). Protein expression is expressed relative to GAPDH to account for differences in protein loading and shown normalized to the Young mean. Representative blots shown below the summary graph. Values are means ± s.e.m. *P<0.05 vs. Young. † P<0.05 vs. Old AL

