
Figure 9.
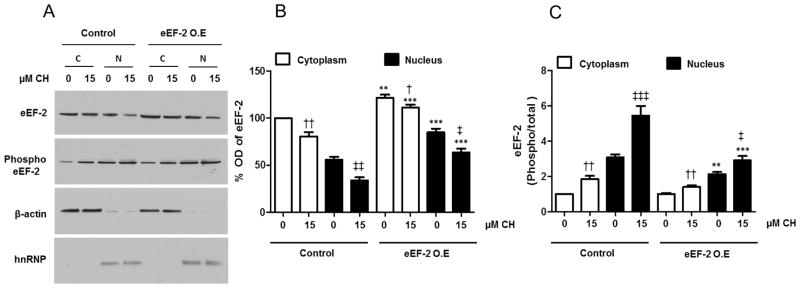
Evidence of efficiency of the over-expression and its effect on eEF-2 subcellular localization in hippocampal neurons subjected to oxidative stress. A. Immunoblots for total and phosphorylated eEF-2 in nuclear and cytoplasmic fractions are shown. β-actin and hnRNP were used as cytoplasmic and nuclear markers. B and C. Optical densities of the total eEF-2 band (B) and the phosphorylated/total eEF-2 bands (C) in nuclear and cytoplasmic fractions. Values are the mean and SEM of four independent infections. ***p<0.001, ** p<0.01, *p<0.05 Control (C) vs. eEF-2 overexpression (O.E.), ††p<0.01 vs. the value for cytoplasm of control cells not treated with CH. ‡‡‡ p<0.001 vs. the value for nucleus of control cells not treated with CH.