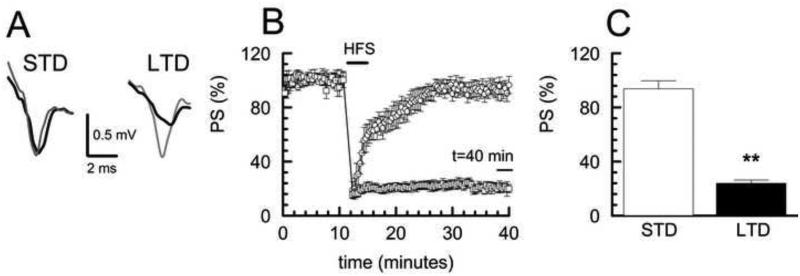
Fig. 2. Cluster analysis determination of STD and LTD populations in WT/Sac control group.
A Representative population spike (PS) traces of STD and LTD for baseline (gray) and 30 minutes after HFS (black). B Long term synaptic plasticity in WT/Sac control group was induced with HFS (4 × 100 Hz, 1 s) producing either LTD (<30% recovery at 40 min, □) or STD (>70% recovery at 40 min, ○) as determined by cluster analysis. Plot shows time course of PS amplitude normalized to initial 10 minute baseline following HFS. STD samples n = 9 slices; LTD samples n= 6 slices; values shown as mean ± SEM. C Comparison of percent recovery of PS at 30 minutes after HFS for LTD and STD clusters showed significance between STD and LTD, (p<0.01).

